



Bitcoin (BTC) continued to struggle on Wednesday as the cryptocurrency market showed limited signs of recovering from last week’s sharp sell-off.
Bitcoin trades around $64,620, consolidating below the psychological $65,000 level as buyers struggle to regain control.
Meanwhile, Ethereum and XRP are also facing resistance, reflecting persistent weakness across the largest cryptocurrencies.
Although Bitcoin’s technical indicators suggest that selling pressure has become overstretched, the broader market structure remains bearish.
BTC continues to trade significantly below its major daily moving averages, while momentum indicators show little evidence of a sustained reversal.
The current setup suggests that any near-term recovery could remain a corrective rebound within the broader downtrend unless buyers reclaim important technical levels.
Bitcoin consolidates below $65,000
Bitcoin remained relatively subdued on Wednesday, trading around $64,620 after experiencing substantial losses during the previous week.
The cryptocurrency has struggled to recover above $65,000, suggesting that buyers remain hesitant to establish larger positions following the recent correction.
While consolidation can sometimes indicate that selling pressure is easing, it does not necessarily confirm that a market bottom has formed.
For Bitcoin, the broader technical structure continues to favor sellers. BTC remains well below its 50-day, 100-day, and 200-day Exponential Moving Averages, indicating weakness across short, medium, and longer-term trends.
The three moving averages are concentrated between approximately $75,700 and $76,000, forming a substantial resistance zone above the current market price.
This difference between Bitcoin’s spot price and its major moving averages shows the extent of the recent sell-off. It also suggests that a meaningful recovery would require stronger buying demand to overcome the technical barriers created during the sell-off.
For now, Bitcoin’s inability to reclaim $65,000 reinforces the cautious outlook. Bitcoin’s momentum indicators suggest that the cryptocurrency remains under significant selling pressure, although the decline may be becoming overstretched.
The daily Relative Strength Index stands near 23, placing BTC deep in oversold territory. An RSI reading below 30 generally indicates that selling pressure has been unusually strong relative to recent buying activity.
Meanwhile, the Moving Average Convergence Divergence indicator remains negative and depressed. This suggests that bearish momentum continues to dominate despite the possibility of a short-term rebound.
The combination of deeply oversold RSI conditions and negative MACD readings presents a challenging technical environment.
While a temporary recovery cannot be ruled out, the broader downtrend remains intact until buyers establish stronger momentum.
Bitcoin technical forecast: BTC faces major resistance near $76,000
Bitcoin faces several important technical barriers if buyers attempt to reverse the recent decline. The first significant resistance stands at the 200-day EMA near $75,723.
A sustained recovery above this level could encourage buyers to challenge the 50-day EMA around $75,767. Beyond this barrier, the 100-day EMA at $76,003 represents another important resistance level.
Together, these moving averages form a concentrated resistance zone that could limit any short-term recovery.
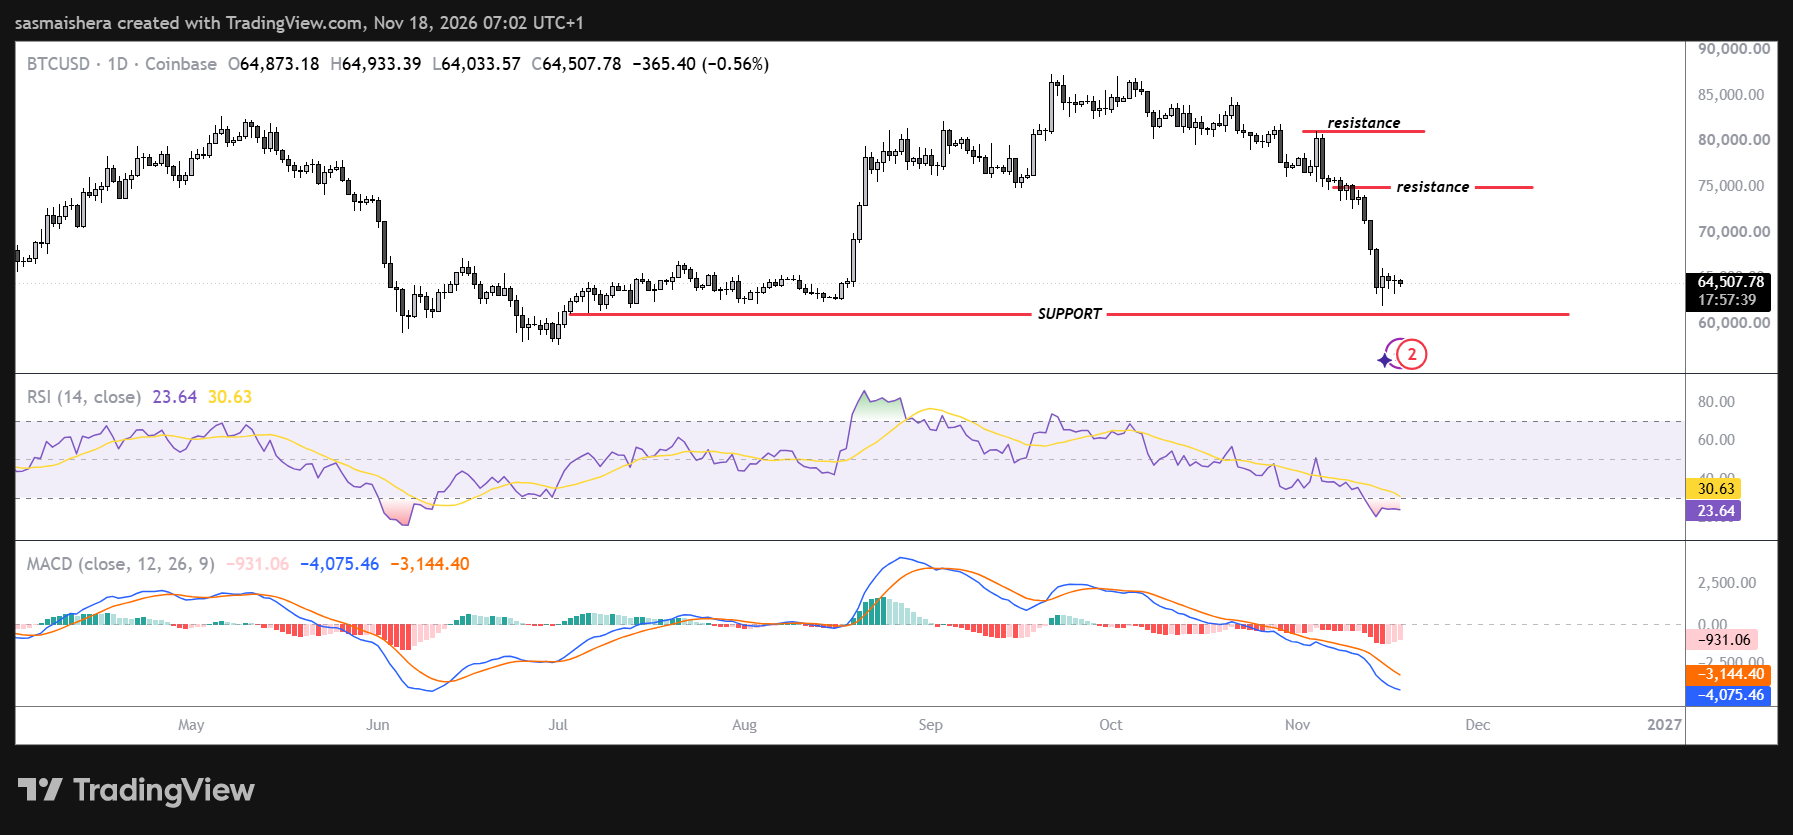
A decisive breakout above the $75,723–$76,003 resistance cluster would provide stronger evidence that bearish momentum is beginning to weaken. Beyond this zone, the next major resistance stands around $85,000.
On the downside, the primary support stands at $61,101. Failure to protect this support level could see Bitcoin drop below the $60,000 psychological level, with another demand zone around $57,000.
Until Bitcoin reclaims its major moving averages, the technical outlook remains bearish.
The post Bitcoin stalls below $65k as bears maintain control appeared first on Invezz

