

Bill Holdings stock continued its strong rally, reaching its highest point since February this year after a top analyst upgraded the company. It jumped to $58.40, up by 82% from its lowest level this year. This rally may continue as the stock has formed an inverted head-and-shoulders pattern, a common bullish reversal sign.
Bill Holdings jumps as analysts turn bullish
The ongoing Bill Holdings surge happened after William Blair’s Andrew Jeffrey upgraded the company from a Market Perform to Outperform. He cited the company’s attractive risk/reward metric, which he believes has turned more constructive.
Also, he believes that the company has improving monetization trends, margin expansion trends, and a good customer profile strategy. On the latter, the company is slowly moving to larger small and medium-sized businesses.
The analyst joins other top Wall Street analysts who have boosted their forecasts for the company. Morgan Stanley’s Keith Weiss recently boosted the target from $60 to $64, while UBS Group’s Taylor McGinnis huked from $60 to $64.
READ MORE: SCHD yields 2.9% while Treasuries pay more: Is the dividend ETF still worth buying?
Other analysts who hiked their targets after the recent earnings were from Citigroup, TD Cowen, Oppenheimer, and Keefe, Bruyette & Woods. In total, the average estimate among analysts is $59.30, up modestly from $58.67, where it was last month.
The most recent earnings report showed that Bill Holdings’ business did well, with its revenue rising by 13% to $353.8 million. Its core revenue, which is made up of its subscription and transaction fees rose by 14% to $316 million, with the float revenue hitting $37.4 million. Float revenue is made up of interest on funds held for customers.
The company also made a $60 million profit during the quarter, a big reversal from the $3 million loss it made in the same period last year. This growth happened as the number of companies using the platfom jumped to 475,300, while the total payment volume jumped by 14% to $102 billion.
The management expects that its revenue will experience some modest growth this quarter. Its target is between $353 million and $363 million, representing an 11% annual growth rate at the upper side of the target. Its net income is also expected to be $102 million.
Further, there are signs that the company is highly undervalued, with its forward price-to-earnings ratio of 13.3 being much lower than the sector median of 19. Also, it has an attractive Rule-of-40 metric of 51. A figure above 40 is usually a sign that a company is undervalued.
Bill Holdings stock price technical analysis
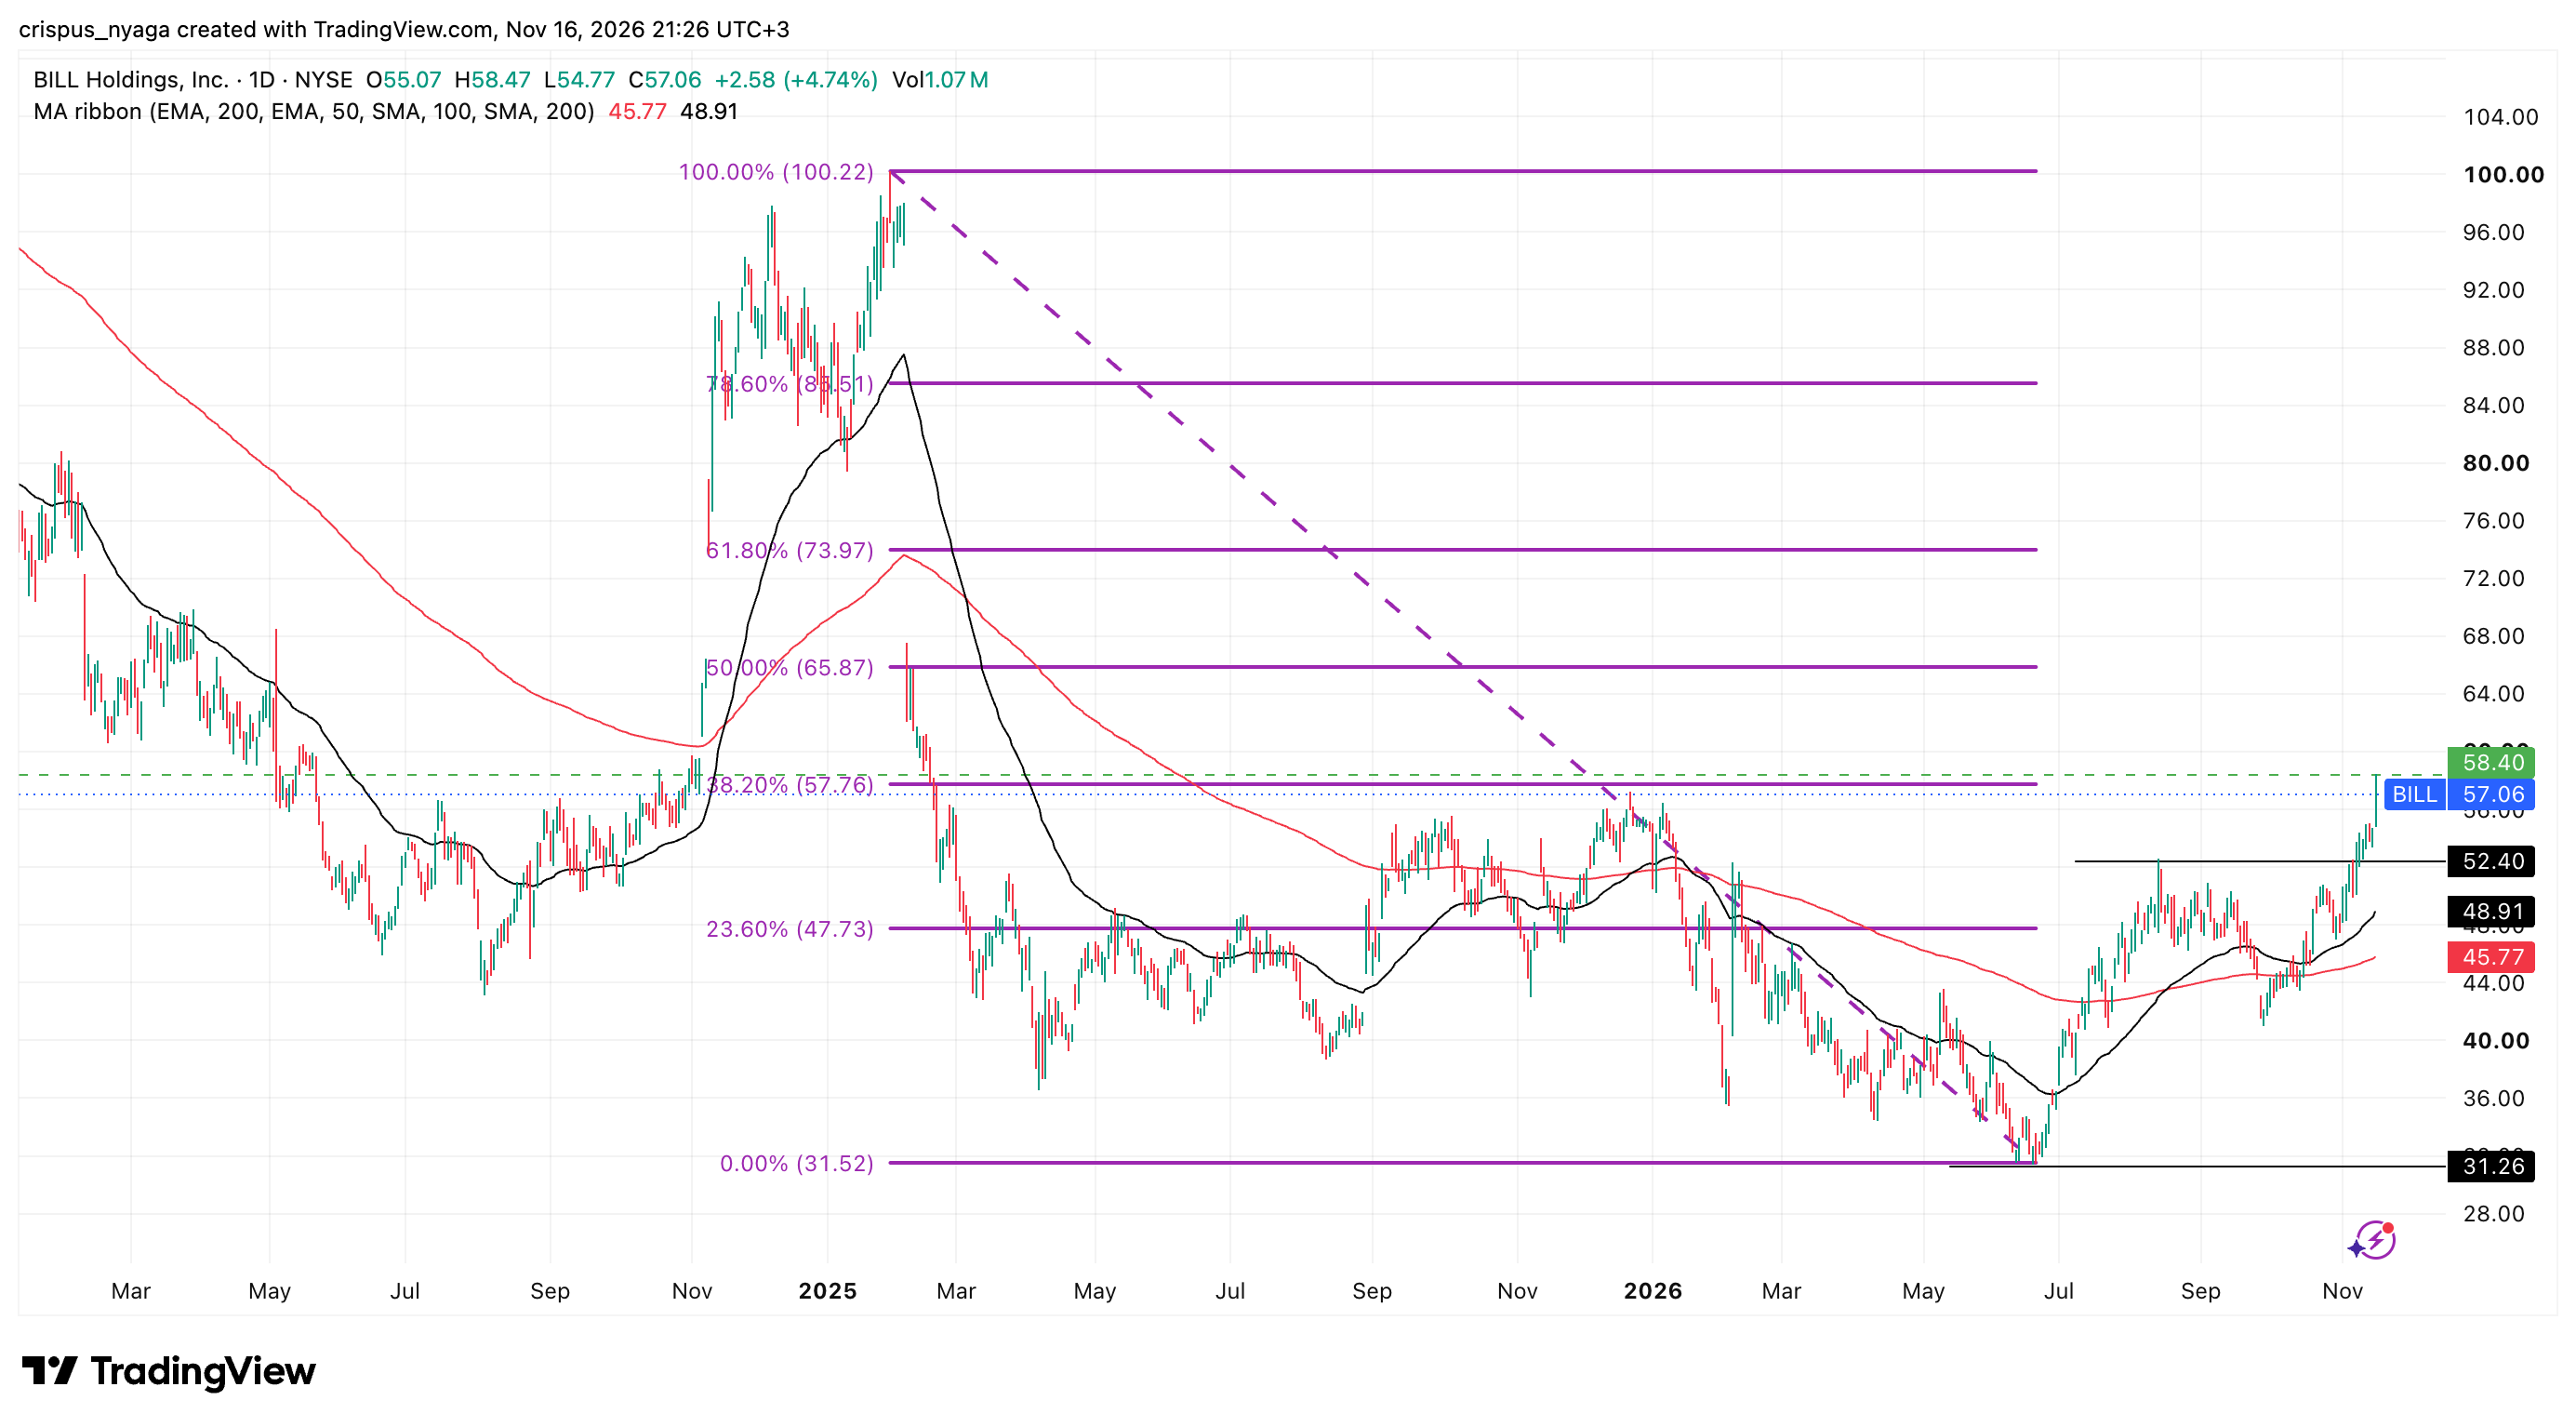
Bill stock chart | Source: TradingView
The daily chart shows that the Bill stock price has jumped in the past few months, moving from a low of $31.26 in June to the current $57.30. It formed a golden cross pattern in August as the 50-day and 200-day moving averages crossed each other.
The stock has jumped above the crucial resistance level of $52.40, the highest swing on August 13 this year. Moving above that level confirmed that bulls have prevailed.
The stock has jumped above the Supertrend indicator, which is a bullish sign. It is also attempting to cross the 38.2% Fibonacci Retracement level. Therefore, the stock will likely continue rising as bulls target the 50% retracement level of $65.80. A move above that price will point to more gains towards the 61.8% retracement at $74. On the other hand, a move below the support level of $45 will invalidate the bullish outlook.
The post Here’s why the Bill Holdings stock surging and what next appeared first on Invezz

