




Ethereum is trading in the green on Wednesday following a poor start to the week. The positive performance over the past 24 hours comes despite several on-chain and derivatives indicators suggesting traders remain reluctant to make significant new commitments.
Holdings across major wallet groups changed only modestly, while exchange net flows remained close to neutral.
US spot Ethereum Exchange-Traded Funds (ETFs) showed some improvement at the beginning of the week, although broader American investor sentiment remains weak.
From a technical perspective, ETH retains a mildly bullish short-term bias above its 20-day and 50-day Exponential Moving Averages (EMAs).
However, the 100-day EMA and the horizontal resistance at $1,961 continue to limit its recovery.
Ethereum whales show limited accumulation
Wallet balances across several large investor cohorts remained broadly stable over the past week.
Addresses holding between 10,000 and 100,000 ETH, typically classified as whales, recorded modest net inflows of approximately 10,000 ETH. The limited increase indicates that large investors are not yet accumulating aggressively.
Wallets holding between 100 and 1,000 ETH and those controlling between 1,000 and 10,000 ETH recorded combined distributions of approximately 50,000 ETH.
The relatively small changes across these groups indicate that major holders remain cautious.
Strong whale accumulation often supports a bullish outlook, while sustained distribution can place additional pressure on prices. Current activity points to neither scenario developing decisively.
Institutional demand showed signs of improvement earlier this week, with the US spot Ethereum ETFs recording $30.85 million and $71.47 million in net inflows on Monday and Tuesday, respectively.
The latest result suggests institutional investors are gradually rebuilding exposure. However, demand remains weaker than the selling pressure observed during the first half of the year.
Sustained ETF inflows could support ETH by absorbing available supply and improving market sentiment.
A single positive session, however, is insufficient to confirm that institutional demand has fully returned.
Ethereum approaches the 100-day EMA
The ETH/USD 4H chart remains bullish despite the consolidating phase Ethereum has experienced in recent days.
The Relative Strength Index stands at 59, signaling positive momentum without reaching overbought conditions.
Meanwhile, the Stochastic Oscillator is near 73. This reading indicates that upside momentum remains present, although the indicator is approaching moderately overbought territory.
The elevated level could limit near-term gains if additional buyers do not enter the market.
Ethereum’s first major obstacle is the horizontal resistance at $1,961. A sustained breakout above $1,961 would strengthen the recovery and potentially open the path toward the next structural resistance at $2,172.
A more extended rally could target the distant barrier near $2,431.
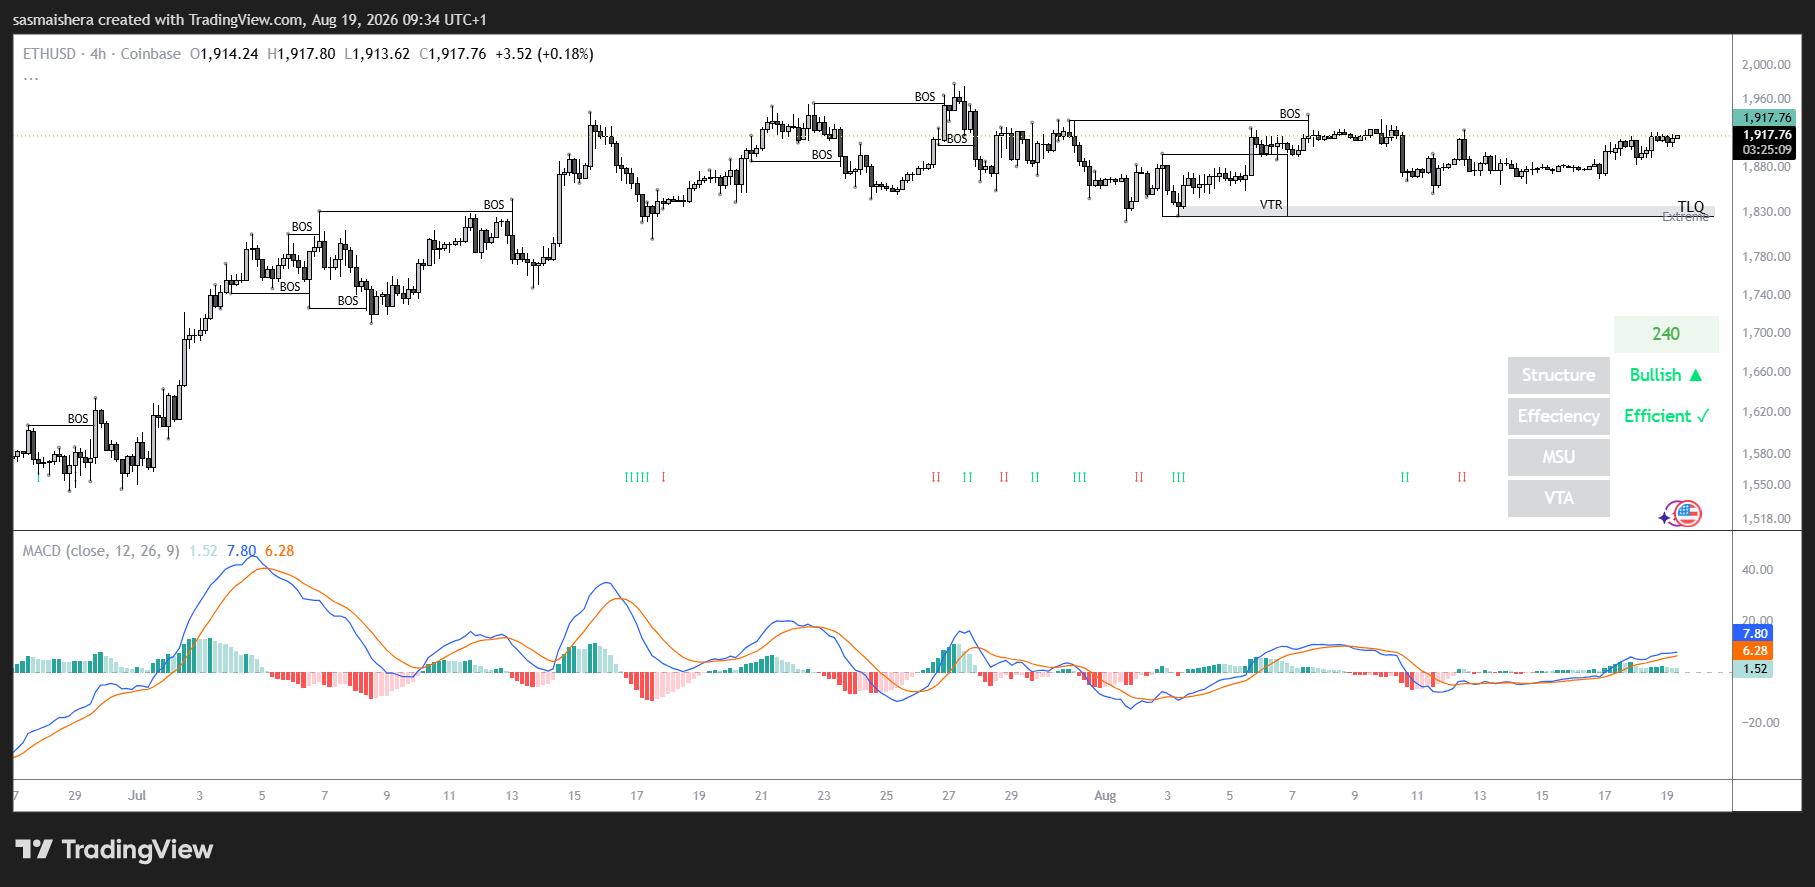
On the downside, the 20-day and 50-day EMAs between $1,870 and $1,889 provide immediate support.
A daily close below this zone would weaken the near-term bullish bias and could expose the horizontal support at $1,809. If selling pressure intensifies, the next major downside level sits near $1,507.
Ethereum’s next directional move will likely depend on whether institutional inflows strengthen and large holders begin accumulating more aggressively.
The post Ethereum nears $2,000, but why are big investors still holding back? appeared first on Invezz

