



Ethereum’s derivatives market is showing reduced leverage as institutional outflows and weak US trading sentiment weigh on its recovery.
CryptoQuant data shows ETH’s Estimated Leverage Ratio (ELR) has dropped to 0.62, its lowest level since November 2025. Meanwhile, US spot Ethereum exchange-traded funds have recorded 10 consecutive days of net withdrawals.
The technical picture remains mixed, with ETH attempting to reclaim its 50-day exponential moving average while facing resistance at $2,548.
Ethereum leverage declines alongside Open Interest
The Estimated Leverage Ratio compares derivatives open interest with the amount of an asset held in spot exchange reserves. It helps assess the scale of derivatives exposure relative to available exchange balances.
Ethereum’s decline to 0.62 comes even as exchange reserves are trending lower.
Combined with falling open interest, the reading suggests leveraged participation has weakened rather than expanded during recent upward price moves.
Lower leverage can reduce vulnerability to cascading liquidations. However, it also indicates that the recovery has attracted limited fresh derivatives exposure.
Ethereum’s Net Taker Volume remains increasingly negative, showing that market-order selling exceeds market-order buying.
The metric points to persistent sell-side pressure in perpetual futures, although it does not independently establish whether every sell order represents a new short position or the closure of a long.
Together with declining leverage, the data suggests traders remain cautious. Reduced leveraged exposure could limit the scope of an extended long squeeze, but it does not remove the risk of further price declines.
The Coinbase Premium Index fell to -0.117, its lowest reading since August 10.
The negative reading signals that ETH is trading at a discount on Coinbase relative to the comparison market, consistent with weaker US buying demand.
Institutional flows also remain under pressure. US spot ETH ETFs recorded $85.4 million in net outflows Monday, with a slight inflow of $24.84 million on Tuesday, according to SoSoValue.
That outflow on Monday extended their withdrawal streak to 10 consecutive sessions, the longest since the May 11–June 3 period. Persistent redemptions remain an obstacle to a stronger recovery.
Ethereum technical forecast: ETH faces $2,548 resistance
The ETH/USD daily chart has been consolidating in recent days. Currently, ETH is attempting to firmly establish strong support at the 50-day EMA near $2,501.
The bulls are looking to reclaim the first horizontal resistance at $2,548, followed by the 20-day EMA around $2,578.
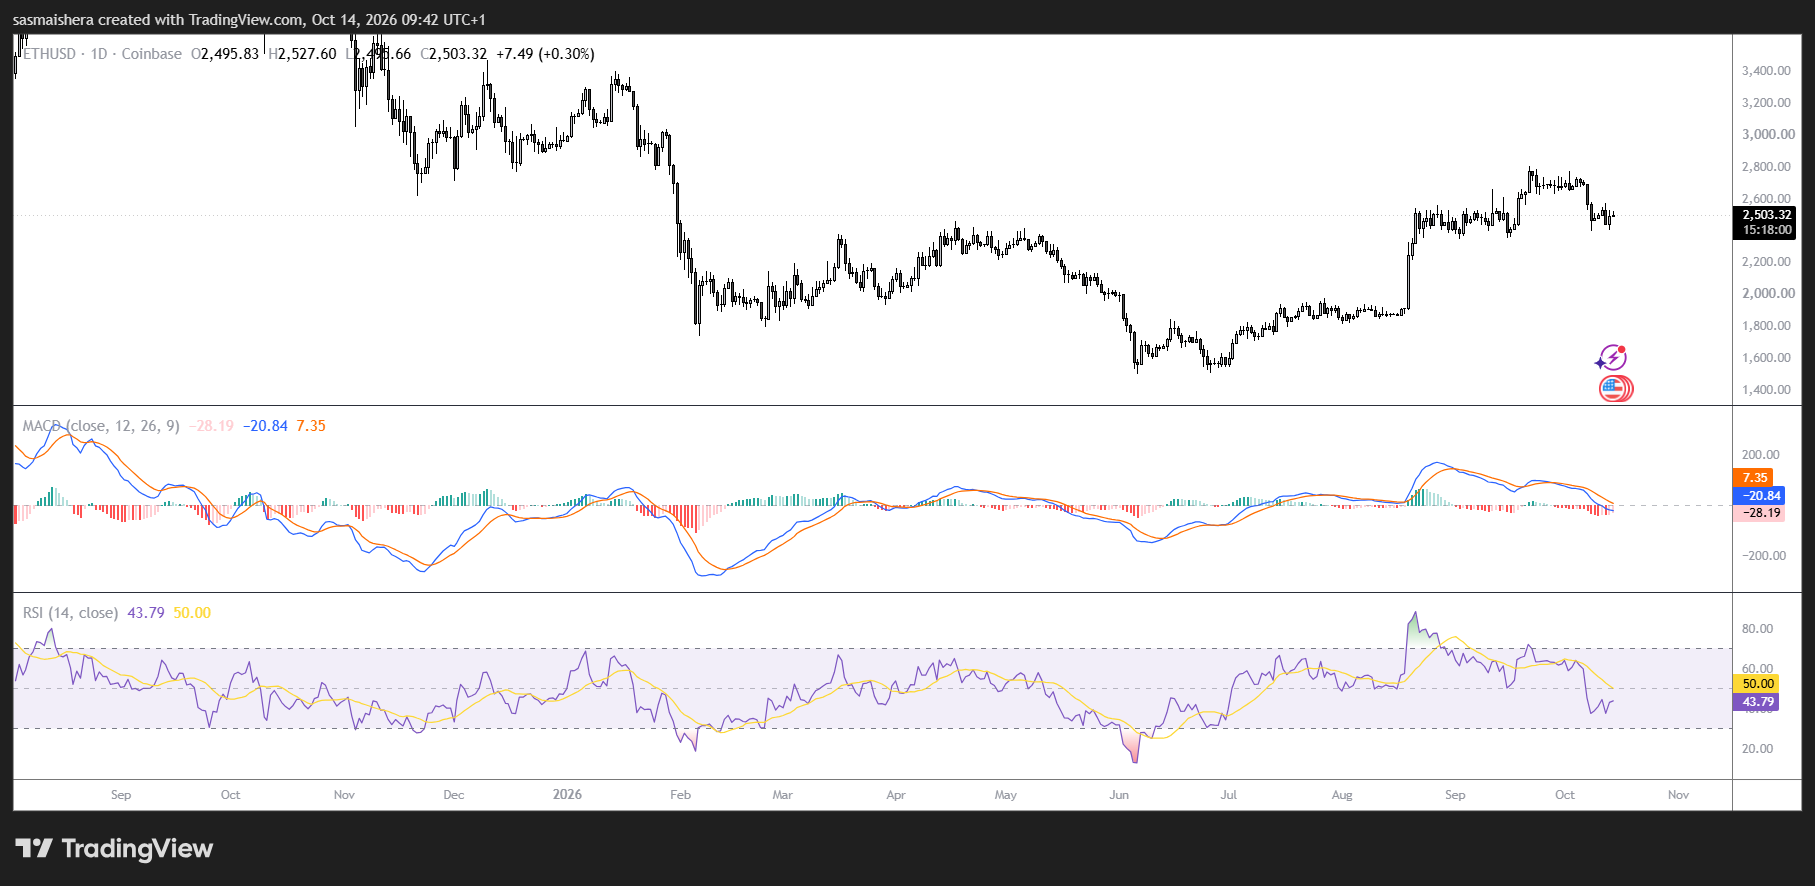
A sustained move above those barriers could bring $2,636 and $2,781 into focus. More distant resistance levels sit at $3,075 and $3,253.
Momentum remains subdued. The Relative Strength Index is around 43, below its neutral midpoint, while the Stochastic Oscillator near 27 indicates weak momentum approaching conventional oversold territory.
On the downside, initial support stands at $2,413. Below that, the $2,355 horizontal level and the 100-day EMA form a support area. A sustained break lower would expose $2,204 and $1,971.
The post Ethereum leverage hits 11-month low as ETF money exits: is ETH losing its buyers? appeared first on Invezz

