


Cardano (ADA) is trading near $0.180 on Monday, up by more than 5% in the last 24 hours.
The recent recovery has helped ease immediate selling pressure, but market signals suggest traders remain uncertain about the token’s near-term direction.
While technical indicators hint at fading bearish momentum, derivatives data continue to show a divided outlook, with no clear consensus among traders.
Derivatives market shows conflicting sentiment
ADA is up 5.5% in the last 24 hours and is now trading around $0.1809 per coin.
The rally comes after the United States and Iran agreed on a deal on Sunday, with the Strait of Hormuz expected to reopen soon.
However, data from CoinGlass highlights mixed positioning in ADA derivatives markets. The long-to-short ratio currently stands at 0.73, near its lowest level in more than a month.
A reading below 1 typically signals bearish sentiment, indicating that more traders are positioning for downside moves.
At the same time, funding rates have shifted into positive territory.
The OI-weighted funding rate for ADA is currently 0.0087%, suggesting that long positions are now paying shorts—a signal that reflects a cautious but improving bullish bias.
Together, these indicators point to indecision in the market, with traders split between continuation of the downtrend and a potential recovery attempt.
Additional data from CryptoQuant suggests early signs of accumulation in spot markets.
Large whale orders have been observed despite otherwise neutral on-chain conditions, hinting that some high-volume participants may be positioning for a recovery.
However, broader metrics remain balanced, indicating that conviction is still limited.
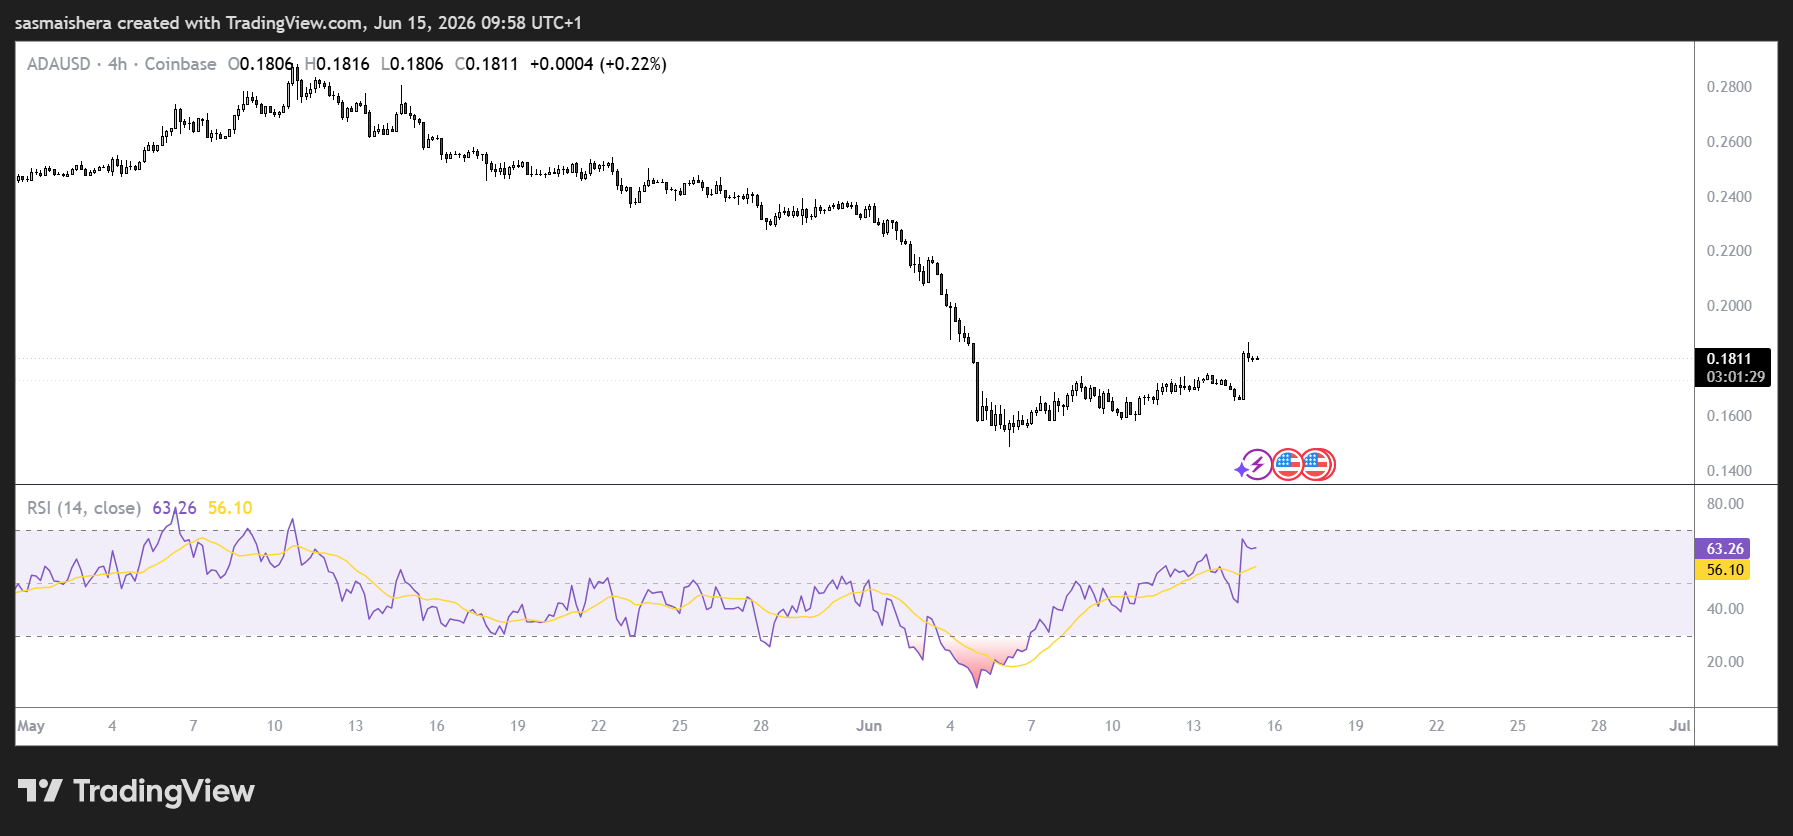
Cardano technical outlook: 4-hour timeframe switches bullish
The ADA/USD 4-hour chart has flipped bullish thanks to the rally over the past few hours.
However, ADA continues to trade below the 50-day EMA at $0.218, the 100-day EMA at $0.247, and the 200-day EMA at $0.322.
Momentum indicators, however, show early signs of stabilization. The Relative Strength Index (RSI) sits at 63, reflecting an improving bullish momentum.
Meanwhile, the Moving Average Convergence Divergence (MACD) has turned slightly positive, suggesting a potential short-term pause in downside pressure.
If the rally persists, the bulls would need to surpass the first major resistance level at $0.190 to enable it to hit the $0.20 psychological mark.
A daily candle close above these levels would pave the way for ADA to extend its rally towards $0.218 (50-day EMA) in the near term.
Beyond this zone, stronger resistance levels are located at $0.258, $0.288, and $0.299, with the 200-day EMA near $0.322 representing a major long-term ceiling.
However, if the bears regain control, they would encounter the first major support at $0.148.
A breakdown below this level could signal renewed bearish momentum and extend the broader downtrend.
With derivatives signaling indecision and technical indicators showing only modest stabilization, Cardano is likely to remain range-bound in the short term.
Traders appear to be waiting for a stronger catalyst before committing to a sustained directional move.
The post Cardano price forecast: can ADA rally past $0.20 after Iran deal? appeared first on Invezz