



Bitcoin’s rally above $87,000 has returned the psychologically important $100,000 level to traders’ radar as institutional inflows, corporate purchases and an improving technical structure support the cryptocurrency’s recovery.
BTC reached its highest level since January on September 22 before retreating from the session high.
The move coincided with gains in technology stocks, suggesting investors were becoming more willing to embrace risk.
Short covering may also have accelerated the advance as traders betting against Bitcoin closed their positions.
The sustainability of the rally, however, will depend on continued demand and whether BTC can remain above its recent breakout levels.
Bitcoin ETFs record $714 million inflow
US spot Bitcoin exchange-traded funds attracted $714 million in net inflows during the rally, marking their second strongest daily performance since October 2025.
BlackRock’s iShares Bitcoin Trust, or IBIT, led the group with $350 million in net inflows. Fidelity’s Bitcoin ETF, known as FBTC, followed with $257 million.
The figures indicate strong demand from investors using regulated products to gain exposure to Bitcoin.
ETF inflows can support the market because issuers generally acquire Bitcoin corresponding to new investments in their funds.
A single day of inflows is not enough to establish a durable trend. Maintaining momentum toward $100,000 may require several sessions of positive flows rather than a brief burst of institutional buying.
Corporate demand has also remained in focus. Strategy disclosed that it purchased another 950 BTC for $75.7 million during the previous week, lifting its total holdings to approximately 846,000 BTC.
The acquisition reinforces Strategy’s position as the largest corporate bitcoin holder and shows that the company is continuing its accumulation strategy as prices recover.
The macroeconomic environment remains a potential obstacle for Bitcoin despite the improvement in market sentiment.
Richmond Federal Reserve President Tom Barkin recently said inflation remained too high and left open the possibility of further interest-rate increases.
Renewed expectations of tighter monetary policy could lift Treasury yields and reduce demand for speculative assets.
Higher yields make government debt more attractive relative to assets that do not generate income, including Bitcoin and gold.
They can also tighten broader financial conditions, reduce market liquidity, and make investors less willing to accept volatility.
Bitcoin’s latest advance has occurred alongside stronger technology stocks, demonstrating its continued sensitivity to changes in risk appetite.
If bond yields resume their climb, BTC could struggle to maintain its current pace even if cryptocurrency-specific demand remains positive.
Bitcoin begins to regain ground against Gold
Bitcoin has also started recovering relative to gold following a prolonged decline in the BTC-to-gold ratio.
The ratio reached approximately 35 when Bitcoin traded near $126,000, and gold moved above $3,500. It later dropped to around 15 as BTC tested the $60,000 region while gold remained close to $4,100.
That decline showed gold preserving its value more effectively during the market downturn.
The ratio’s subsequent recovery to approximately 20 indicates that Bitcoin has started outperforming the precious metal again.
Long-term charts show the ratio rebounding from the lower boundary of an ascending channel extending back to 2013.
Similar rounded recoveries in 2015 and 2019 eventually produced breakouts, while the rally following 2022 failed to clear its previous high near 40.
The current rebound remains too young to confirm a comparable pattern. The ratio must establish higher monthly lows and remain above the long-term support area near 12.
A sustained rise above the 30–35 region would provide stronger evidence that Bitcoin is reclaiming leadership over gold.
Conversely, a drop below 12 would threaten the broader ascending structure and suggest that gold remains the stronger store of value.
Bitcoin breakout puts $100,000 in sight
Bitcoin’s technical picture has improved following the formation of a potential bottom between $50,000 and $60,000.
BTC has moved above its 50-week simple moving average and remains within a broad ascending channel that has guided its price action since 2018.
A possible cup-and-handle formation also points to additional upside if buyers maintain control.
On the daily chart, Bitcoin consolidated below $67,000 from June through August before moving above the $80,000 area.
A second period of consolidation during the first half of September preceded the breakout above $82,300.
Holding that level would preserve the bullish structure and keep $100,000 as the next major objective. A decisive breakout above $100,000 could then open a potential path toward approximately $135,000.
The Relative Strength Index remains above its midpoint, supporting the positive momentum outlook without necessarily indicating that the move has become excessively stretched.
Bitcoin’s outlook now rests on the interaction between institutional demand, macroeconomic conditions, and technical support.
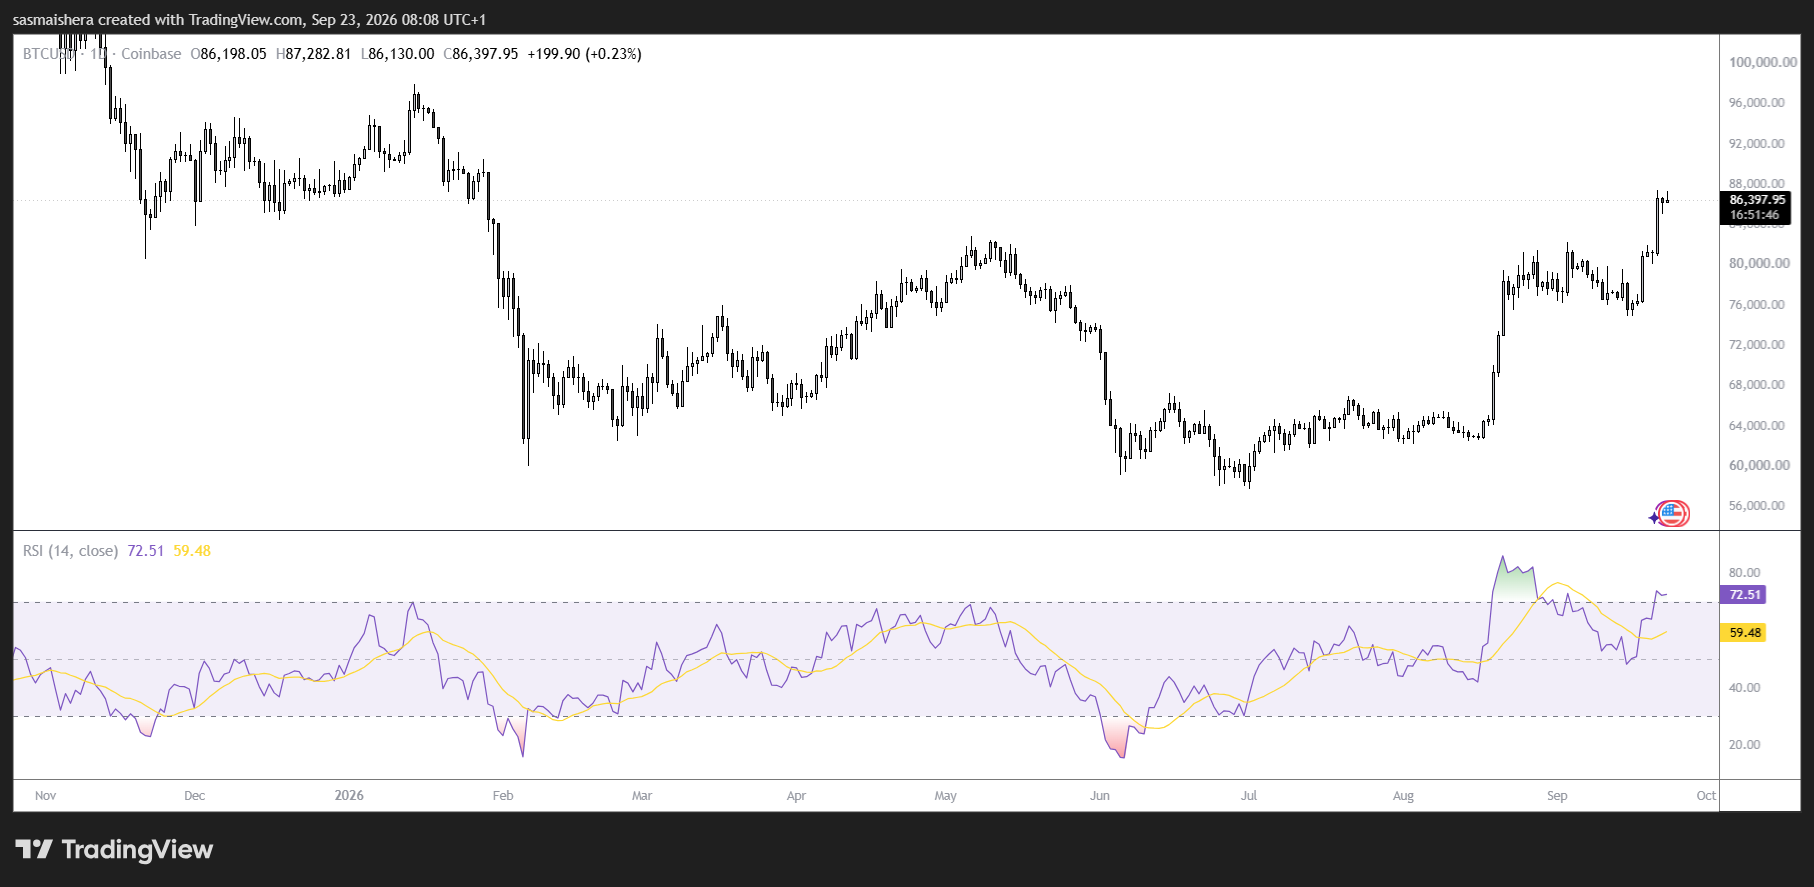
Continued ETF inflows and further corporate purchases could help sustain the advance. The bullish argument would weaken if inflows reverse, Treasury yields climb sharply, or BTC falls back below $82,300.
Bitcoin must also outperform gold—not simply rise in dollar terms—to strengthen the case that investors are rotating toward it as an alternative store of value.
For now, holding above $82,300 keeps $100,000 in focus, but the next phase of the rally will require continued buying rather than momentum alone.
The post Bitcoin is back above $87,000: what must happen before BTC can reach $100,000 appeared first on Invezz

